
Published March 20, 2020
5 Simple Graphs Proving This Is NOT Like the Last Time


With all of the
volatility in the stock market and uncertainty about the Coronavirus
(COVID-19), some are concerned we may be headed for another housing crash like
the one we experienced from 2006-2008. The feeling is understandable. Ali
Wolf, Director of Economic Research at the real estate consulting firm Meyers Research, addressed this point in a recent interview:
“With people having PTSD from the last time, they’re still
afraid of buying at the wrong time.”
There are many
reasons, however, indicating this real estate market is nothing like 2008. Here
are five visuals to show the dramatic differences.
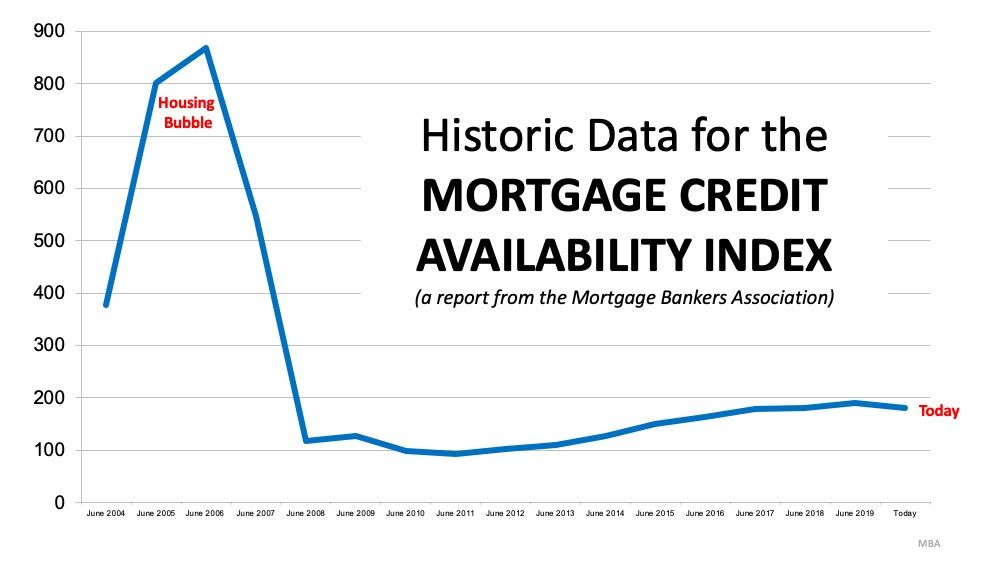
1.
Mortgage standards are nothing like they were back then.
During the housing bubble, it was difficult NOT to get a mortgage. Today, it is tough to qualify. The Mortgage Bankers’ Association releases a Mortgage Credit Availability Index which is “a summary measure which indicates the availability of mortgage credit at a point in time.” The higher the index, the easier it is to get a mortgage. As shown below, during the housing bubble, the index skyrocketed. Currently, the index shows how getting a mortgage is even more difficult than it was before the bubble.
2.
Prices are not soaring out of control.
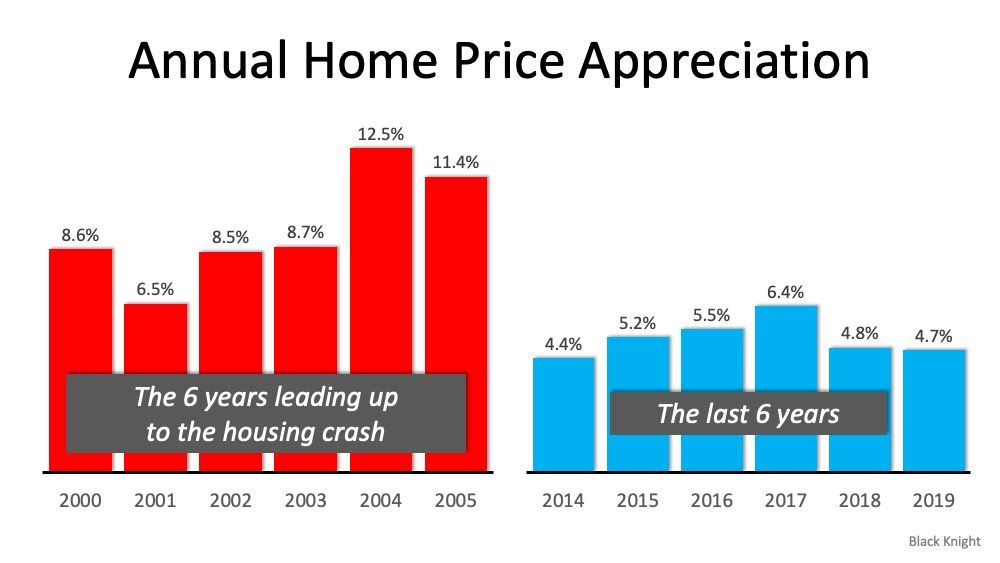
There’s a stark
difference between these two periods of time. Normal appreciation is 3.6%, so
while current appreciation is higher than the historic norm, it’s certainly not
accelerating beyond control as it did in the early 2000s.
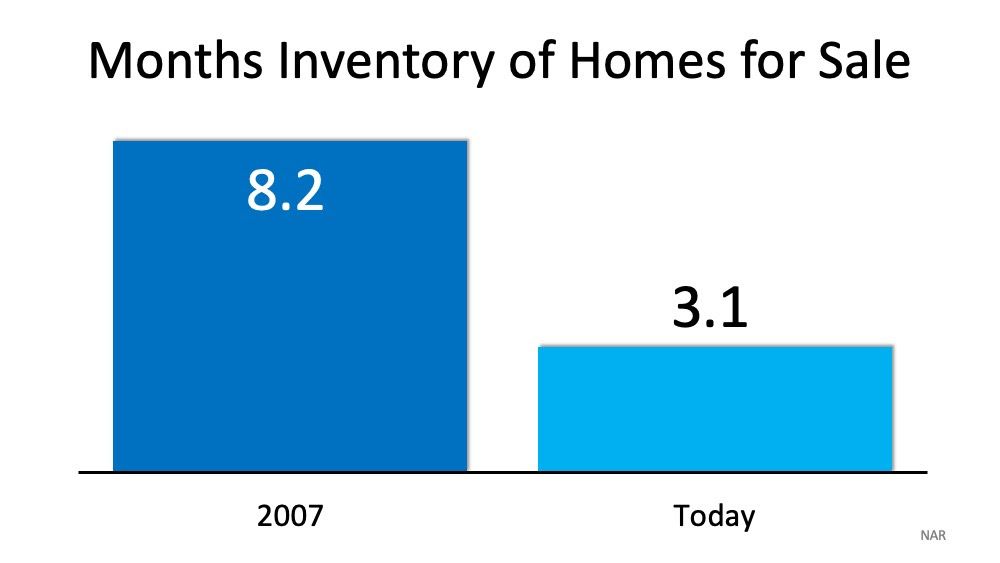
3.
We don’t have a surplus of homes on the market. We have a shortage.
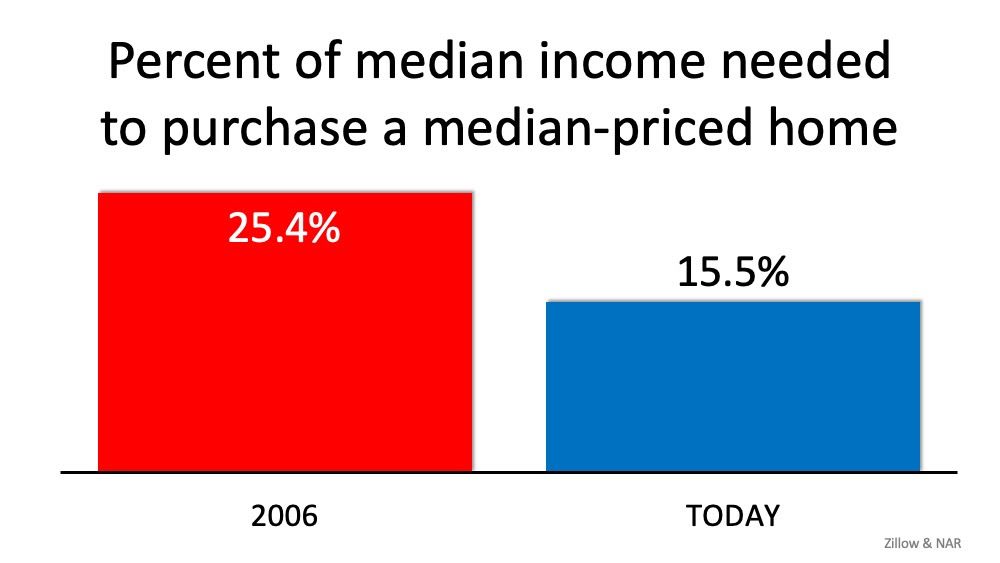
4.
Houses became too expensive to buy.
5.
People are equity rich, not tapped out.
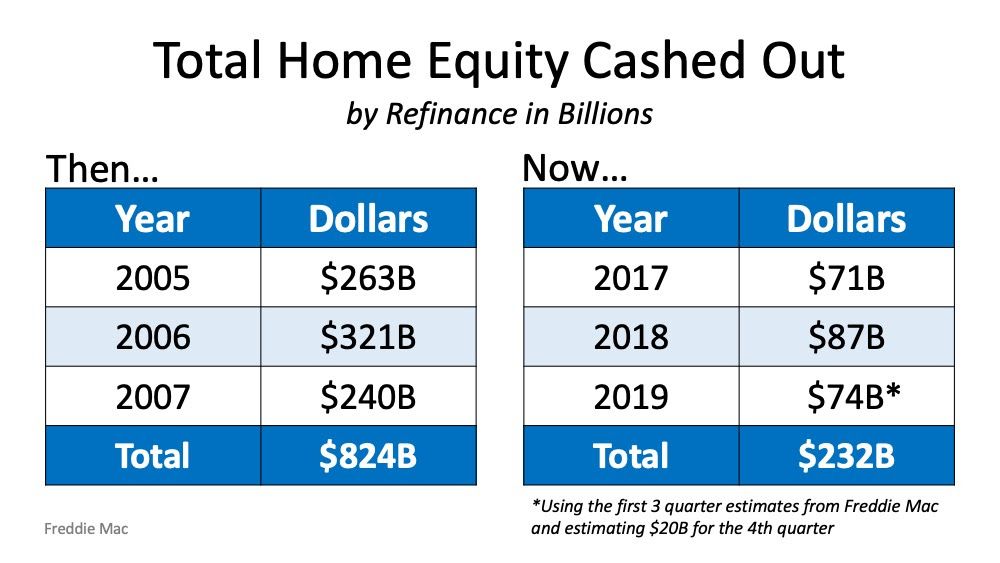
During the crash, home
values began to fall, and sellers found themselves in a negative equity
situation (where the amount of the mortgage they owned was greater than the
value of their home). Some decided to walk away from their homes, and that led
to a rash of distressed property listings (foreclosures and short sales), which
sold at huge discounts, thus lowering the value of other homes in the area.
That can’t happen today.
Bottom
Line
If you’re concerned we’re making the same mistakes that led to the housing crash, take a look at the charts and graphs above to help alleviate your fears.
.png)